
- 25 July 2018
Undeniable Proof That Property Club Is The Best!
Kevin and I were discussing recently how one of the most common questions we get, is: "How and why are Property Club the best? What proof do you have?"
So I got working on it!
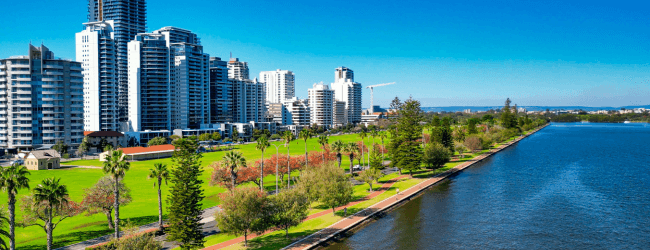
Property Club has been in existence for just on 25 years, since 1994!
A lot of members have reaped the benefits of holding properties for the long-term that are well researched, best placed for capital growth.
When Kevin and Kathy started Property Club, they just had a desire to help out friends and family, having no inkling of the phenomenal ways they would affect people's lives for the positive, along with creating the behemoth that we are today!
So this investigative journey took me to the first 100 purchases with Property Club, all the way back in 1994/1995.
The results are startling!
(these results are valuation reports put together by the industry bible for property in Australia, RP Data/Core Logic)
Having an average price of $140,000, being well located property, close to major capital cities, the total purchase price of these painstakingly researched properties was just over $14 million.
Today, the value of these properties stands at an eye-watering $40 million!
Yes, the first 100 Club members are sitting on $25 million of total capital growth, just over $250,000 each!
And that is just for the one property that they purchased!
The average Property Millionaires Club (PMC) member has 4 properties!
This is a lot better retirement than they would have had if they just stuck to their Super!

So, how long do I need to hold a property for?
RP Data / Core Logic recently released their Pain & Gain Report - December Quarter 2017 (released March 2018).
This is a quarterly assessment of realised gross profit and loss based on dwelling re-sales over the December Quarter of 2017.
The report showed that Ninety One per cent of the properties which were resold over the final quarter of 2017 resold for a price which was in excess of their previous purchase price.
Houses that sold at a loss over the December 2017 quarter were owned for a median 6.4 years compared to a median of 9.2 years for those sold at a profit.
For units, those sold at a loss had a median hold period of 7.2 years while those sold for a profit were typically held for 8.0 years.
Capital city houses resold at a loss had a median hold period of 5.4 years compared to 6.2 years for units.
Capital city houses resold for a profit were typically held 9.6 years compared to 8.0 years for units.
In a previous report, the data also highlights the fact that ownership of property, whether for investment or owner occupier purposes, should be seen as a long-term investment. Across the country, those homes that resold at a loss had an average length of ownership of 6.3 years. Across all sales recording a gross profit the average length of ownership was recorded at 10.3 years, while homes which sold for more than double their previous purchase price were owned for an average of 17.7 years.
Further illustrating, that due to this lower inflation environment we are in, along with ASIC / APRA intervention in our property markets, that the doubling period for property has increased and it is still happening!

The alternative - Superannuation?
Our superannuation industry’s value stands at around $2.6 trillion.
Recently, the Productivity Commission published a draft on the failure of super trustees and regulators to safeguard members’ financial interests.
The report made for sobering reading...
Of 14.6 million accounts analysed by the commission, about a quarter were judged to be underperforming. A “typical full-time worker” investing in an underperforming fund, the report says, may retire with a balance 53 percent lower (or $635,000 less) than what they would have accumulated in a top performing fund.
Excessive insurance premiums and fees and holding multiple accounts - which many workers do as a result of changing jobs - also could leave a worker’s nest egg tens of thousands of dollars worse off!
Females have more challenges in the superannuation stakes, as the recently released Financy Women’s Index for the June quarter indicates that women are still facing a gender pay gap of 15.3 percent and a superannuation savings gap of 30 per cent at retirement age.
Financy Women’s Index is based on data from over 700 annual company reports (as well as monthly, quarterly, biannually, and biennially) and methodology from the Australian Bureau of Statistics, the Australian Securities Exchange, the ATO and the Australian Government Department of Education and Training.
The Association of Superannuation Funds (ASFA) for the March quarter 2018 figures show couples aged around 65 living a comfortable retirement need to spend $60,264 per year and singles $42,764.
The estimates of savings required at retirement remain at $640,000 for a couple and $545,000 for a single person.
Sadly, there is a big disparity between the required funds for a comfortable retirement and the actual.
Males in the 60 to 64 year old age bracket are retiring with around $270,000
Females in the 60 to 64 year old age bracket are retiring with around $157,000
Further illustrating, that now for nearly quarter of a century, Property Club has been assisting its members to safely invest in residential property, with thousands of members reaping the benefits of holding property for the long-term!
Change your retirement for the better, by making contact with your Property Mentor to look at the best options available for you!
Related Posts

Kevin Young says ... it's time to make money...how! Why now?
Hi folks. It’s time to make money. Why? Because there’s fear in the market out there. Every day the papers are negative, negative, negative. Capital gains are going to be cancelled! Capital growth is going to be cancelled! You know what that does? It makes the average person stop like a bunny in the headlights of a...

Melbourne’s Inner West Is Still One of the Smartest Plays Right Now
There’s a pocket of Melbourne’s inner west quietly gaining momentum. Not the loudest market. Not the most hyped. But one that continues to show the kind of fundamentals experienced investors look for. And right now, it is sitting in a very interesting position. Location still does the heavy lifting This part of the...
What Trees Tell You About a Property Market
Perth has just been recognised as a Tree City of the World for the third year running . Not exactly the kind of headline most investors chase. But it should be. Because this isn’t about trees. It’s about how a city is being run . The signal most investors miss Property markets don’t just grow because of population...