- 17 December 2015
The charts paint a pretty picture for property
There is so much media melodrama about housing bubbles, busts and booms that it’s hard for the average investor to know what’s really going on. Are house prices really unaffordable? Will there be a decline in prices?
Perhaps the best way is to ignore the sensational words and concentrate on some good old “facts and figures” charts that clearly indicate where our property market is going.
House Prices and Affordability
To begin with, let’s look at house prices and affordability. Look at the chart below, numbered from the top down 1, 2, 3, 4 (where 1 is the green, 2 is blue, 3 the deeper purple and 4 the orange.
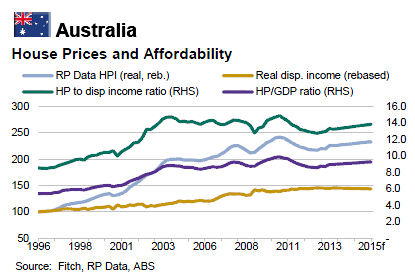
The green line on the chart shows house prices compared to disposable income. Despite all the hysteria in the media about booming property prices and busting property prices, you can see that we are, in fact, in a steady pattern that we have been in since 2002.
You will notice there was a steep jump from 2000 to 2002 caused by Government greed. For the first time, 10% GST was added. Now they are talking about increasing the GST to 15%. What effect do you think that is going to have on property prices over the next two years?
The next line (Blue), says that house prices again across the country have been pretty steady since 2010 and certainty nothing to justify the hysteria that caused APRA's ill-fated attack on property supply. So with builders not proceeding because of the lack of off plan buyers that banks are insisting on, what is going to happen to the volume of new building? If it falls, which I think it will, as is happening right now, then what is going to happen to prices?
The third line (Purple) is the house prices as a percentage of gross domestic product or Australia's wealth. Again here it has been stable since 2003 and again putting the lie to the media hysteria of a property boom and impending bust. If you draw a vertical line from 2010 you will see a distinct jump in prices. This shows that when the RBA increase the cost of money it feeds into inflation and here are the inflated property prices. You will recall that your Club petitioned all the RBA offices around Australia in 2009 warning not to increase rates. We continued this advice to the RBA as they steadily, and foolishly as it turns out, ratcheted rates up to 4.75%.
The good thing about this is that the RBA have now learned their lesson and to quote the Governor "we are in for a decade of low rates". Thank you Mr Stevens, this is something the world knew 15 years ago - and the Club advised you and your predecessor.
Finally the fourth line (orange) is real disposable income which rose steadily until 2007 and has stayed at this peak ever since. Traditionally, though some readers might dispute this, disposable income goes up under the Liberals and is subdued under Labor. Older readers will recall that Bob Hawk bought in the accord to contain wages growth.
Cheaper properties – cheated profits
House prices analysis
You can interpret some valuable lessons from these charts. For example, the question when you are starting out in property is “should I buy dearer or cheaper property?”
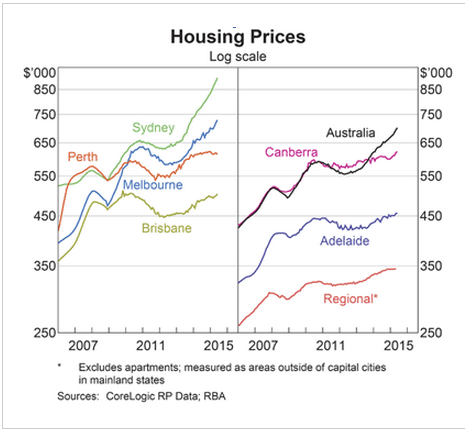 Capital City vs Regional Housing Prices
There are gurus out there who recommend cheaper properties and lead by their own poor examples. Let's take Sydney; it started out at about A. $550,000 and we'll compare it to the regionals which started out B. $300,000 cheaper at $250,000. In the same period of time how have they grown in comparison?
Sydney has grown $350,000 and the regionals have grown $100,000. So investor A. in Sydney has spent the same amount of time but has pocketed so much more. Investor B. in the regionals has waited the same length of time but has squandered that time by not maximising his or her potential.
I don't favour regionals.
Related Posts

Kevin Young says ... it's time to make money...how! Why now?
Hi folks. It’s time to make money. Why? Because there’s fear in the market out there. Every day the papers are negative, negative, negative. Capital gains are going to be cancelled! Capital growth is going to be cancelled! You know what that does? It makes the average person stop like a bunny in the headlights of a...

Melbourne’s Inner West Is Still One of the Smartest Plays Right Now
There’s a pocket of Melbourne’s inner west quietly gaining momentum. Not the loudest market. Not the most hyped. But one that continues to show the kind of fundamentals experienced investors look for. And right now, it is sitting in a very interesting position. Location still does the heavy lifting This part of the...
What Trees Tell You About a Property Market
Perth has just been recognised as a Tree City of the World for the third year running . Not exactly the kind of headline most investors chase. But it should be. Because this isn’t about trees. It’s about how a city is being run . The signal most investors miss Property markets don’t just grow because of population...